XPAR Vision is a firm believer that the current performance of the glass container industry has not reached its limit. Weight reduction, waste reduction and zero defects production are now possible by using the company’s equipment. In a series of exclusive articles for Glass Worldwide, Paul Schreuders shares the results of implementing the company’s technologies and how they help the glass industry.

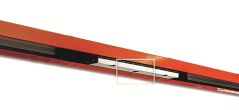
In parts seven and eight of this series, the capability of the XPAR Vision Blank side Temperature Control (BTC) solution (figure 1) was explained, as well as its accuracy of measurement related to different types of sensors available in the market. In summary, the BTC allows for multiple automatic and accurate measurements within one cycle of both glass (parison) and metal (blanks, neck rings, plungers) and therefore allows for constant monitoring without consuming operator time while generating valuable feedback information.
The following article focuses on measuring the temperature of the blank mould and in particular, identifying the best spot.
Position
To measure the temperature of the blank, the user has to decide at which position to monitor the temperature. Which position or multiple positions give the best information about temperature trends, as a result of changes in the glass forming process.
With BTC, it is possible to set up multiple points for blank temperature measurements. Every user is inclined to think that more points for each blank mould give more information and more information is better to monitor the glass forming process. But is this true? The downside of more measuring points is more set up time, more measuring time and the user (operator) must digest all of this information, because every measuring point has its own chart and alarm.

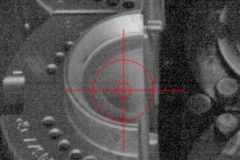
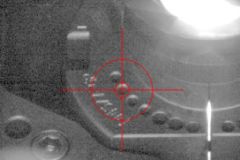
To give a good scientific answer to the question ‘Which position is best?’, XPAR Vision conducted research, setting up the BTC to measure the following positions: Neck blank, middle blank, top blank, cooling hole blank for the left and right blank (see figure 2).
Once the temperature measurements start, events in the glass process are awaited, like the event in figure 3, which shows that the blank temperature rises and there is a blank change. Due to the event, it is possible to correlate all measurements and make a statement about the right position.
In figure 4, the neck versus the hole is correlated and also the middle against the hole position, while figure 5 depicts the temperature correlation between the middle and the hole position and figure 6 shows the temperature correlation between the top and the hole position.

Correlation
As can be seen, all of the positions are very well correlated. This means that all positions give the same information about temperature change trends, so for an easy and fast set up of the BTC for monitoring or automatically controlling the temperature trend, the best position is on top of the blank mould. Most specialists would object at this point and will state that the position in the blank near the filling level is a much better position, because it gives information about the temperature profile in the blank. Yes, they are also correct. To gain insight about the temperature distribution in the blank, there must be more positions in the blank but for monitoring alone, any point will do!

Best of both worlds
To have the best of both worlds, XPAR Vision recommends the nest setup: For one section, the BTC should be set up with multiple points, with the desired position in the blank and a positions at the top of the blank. In this way, it is possible to learn about the temperature distribution of a design; the blank and parison combination. For the remaining sections, users can set up the position at the top of the blank. This results in a fast set up and fast measuring time of the BTC, which means a short turn-around time for all sections and tighter control of the temperature feedback loop.


