Need more information?
Get in touch with Paul Schreuders (CEO)
- +31503162888
- schreuders@xparvision.com
XPAR Vision is a firm believer that the current performance of the glass container industry has not reached its limit. Weight reduction, waste reduction and zero defects production are now possible by using the company’s equipment. In a series of exclusive articles for Glass Worldwide, Paul Schreuders shares the results of implementing the company’s technologies and how they help the glass industry.

As explained in related articles in recent issues of Glass Worldwide, the GobAssist (GA) monitors essential loading parameters, including:
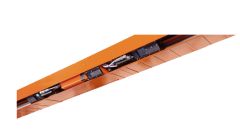
The GA (figure 1) is mounted on a rail system and measures these loading parameters sequentially, section by section. Two high speed cameras capture the trajectory of the gob falling from the deflector into the blank mould. The GA software analyses the many images and gives detailed information about the loading process.
Where previous articles focus on gob speed, length, position and time of arrival, this fifth contribution focuses on how the loading influences the forming process and bottle quality and more specifically, glass thickness. As everybody knows, glass thickness variation leads to spilling of glass to compensate for thin spots/areas in the bottle. Glass thickness variation by nature affects the quality of the bottle and specifically, the strength of the bottle negatively.
Moreover, glass thickness variation is a limiting factor for lightweight bottle production. Studies confirm that because of the glass thickness variation, both horizontally as well as vertically glass containers generally contain 30% to 40% more glass than is strictly required. As explained here, a major part of this 30% to 40% relates to loading.
In order to explain a solid relationship between glass thickness variation and loading variation and because in glass container production there are no in-line thickness measurement tools available at the hot end, first it will be proved that there is a one-to-one correlation between glass thickness variation and intensity variation. Intensity is a measuring unit that is used by XPAR Vision’s InfraRed Dual camera system to quantify the amount of radiation of every single bottle produced. Once proven that there is one-to-one correlation between glass thickness variation and intensity variation, intensity instead of glass thickness will be used to explain the solid relationship between glass thickness variation and loading variation.
With an in-house developed thickness measurement system (figure 2), it is possible to measure the absolute wall thickness of the bodies of bottles produced. The result of the thickness measurement is shown in figure 3. This data is from an NNPB beer bottle. Of course, data from a blow-blow wine bottle will look different. From figure 3, the huge thickness variation can be identified.
Having many bottles measured in line by the InfraRed Dual camera system (intensity) and off line by the thickness measurement system, allow for a diagram to be plotted with a thickness estimate (based on intensity) on one axis and absolute thickness on the other. The result, being a one-to-one correlation between glass thickness variation and intensity variation, is shown in figure 4.
Now the one-to-one correlation between glass thickness and intensity is understood, it should be explained that via intensity, glass thickness variation is highly influenced by loading.
Through many experiments, the intensity of the bottle is measured in specific zones with (different) offsets, for example, in the position of gob loading into the blank mould.
The results speak for themselves and are visualised in figure 5: An offset from the centre of a little more than only 1mm leads to a huge spread (= variation) in intensity and thus, glass thickness. Based on these experiments and results, it can be concluded that a deviation of more than 1mm already has a significant influence on the forming process and bottle quality. For NNPB at least, the sensitivity of wall thickness from loading variation is huge.
Knowing that and understanding how operators and specialists steer the loading process, it has to be concluded that a huge spread in intensity (and thus glass thickness) is part of today’s normal forming process capability. Without the help of the GobAssist and only using experienced eyes to put the gob at the best loading position leads very often to loading positions of more than 3mm off the real centre, the best at 2mm, taking at least 10 minutes’ adjustment time. With the GA as an aid and by looking at the screen, the operator is able to centre the gob safely and accurately within a minute, while keeping length, time of arrival, shape and speed within limits.
Today’s forming process has a lot of room to improve. Applying hot end sensor technologies like GobAssist allows for actual and dramatic improvements to the forming process. The experiments described clearly show the potential of stable and precise loading on intensity and thus, glass thickness variation. Decreasing glass thickness variation both horizontally as well as vertically allows for a weight reduction. Although difficult to prove, based on today’s use of 30% to 40% more glass than is strictly required, stable and precise loading could easily save half of that amount. And everybody in glass will understand the significant side-effect of this: The opportunity to increase speed, which turns out to be the main profit contributor.

