Following his views on optimising forming process stability and reducing the weight of glass in general terms (Glass Worldwide issue 74), from issue 75 onwards Paul Schreuders explores the different (individual) steps to be taken towards optimising forming process stability and reducing the weight of glass containers. Here, the focus is on various blank side disturbances that have not yet been touched by former issues and how XPAR Vision’s solutions can help.
As explained in issue 74, following the Paris Climate Change Conference (COP21) and taking their social responsibility seriously, many if not all food and beverage packing companies are actively working to reduce their carbon footprint. Since packaging is a substantial part of this carbon footprint, supply chain collaboration is a key for success. Knowing the competitive field of metal, plastics and bio-based packaging, for glass the keys to survival are to recycle and reduce weight (improving the content-to-glass ratio). Reducing weight requires further optimisation of forming process stability.
Blank side disturbances
From previous articles in this series, it has been explained that instability of gob weight, gob temperatures, gob homogeneity, gob loading and parison design reflect highly on the parison forming stage. Deviations in the above-listed conditions lead directly to bad parison forming, resulting in poor quality of the glass container. At the blank side, more process disturbances affect the stability of the forming process and ultimately the quality of product. With IR-D (infrared measurements) disturbances due to swabbing blanks and neck rings, wrong blank side IS timing setup, blank mould condition and cooling condition can be detected.
Logically, any glassmaker would reduce the disturbances to the forming process to a minimum. Process stability is key for production efficiency and a crucial pre-condition for implementing speed increase and lightweight glass container production.
IR-D’s infrared measurements of each container show in real-time the effects of changing conditions of the forming process in the blank side. Typically, these effects are similar for all forming processes (blow-blow, press-blow and NNPB).
Swabbing blanks
One big and crucial disturbance at the blank side is swabbing of blanks and neck rings. For each production run, a scheduled swab frequency is needed to keep the sections running. A carbon layer on the inside of the blank profile is needed to keep the friction between glass and blank at an optimal condition, in order to prevent section blockages that result in urgent operator interventions and negative effect to pack efficiency. At the same time, it optimises the contact between glass and blank surface in order to avoid several kinds of defects.
Because of the high frequency needed and the number of different people involved (multiple groups/shifts), swabbing is one of the most discussed operating procedures in the glass container industry. It is obvious that it is very difficult to get everybody aligned to perform the swab in an identical way.
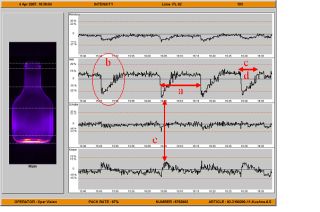
The IRD measurements show on a real-time basis the actual impact of the way each operator swabs the blanks, eg which part of the blank is swabbed with how much grease. Even the swab interval (frequency by SOP) is shown precisely. In other words, the swab performance can be followed at any time.
Poor swabbing performance, poor quality
In figure 1, an example is given that shows (a) the frequency, (b) the impact, (c) how long it takes before the process stabilised again, (d) how many bottles are affected or should be rejected and (e) the effect for the glass distribution in the bottle.
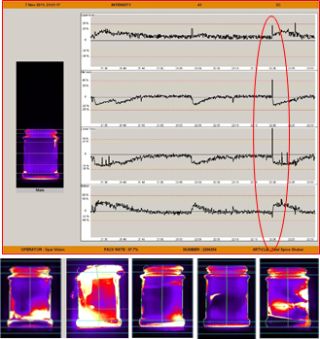
The impact of swabbing on the quality of the glass container is strongly correlated. However, in cold end inspection, this relationship cannot be identified. The consequence is that critical defects resulting from poor swabbing performance lead to activation of the MNR (mould number reader), resulting in unnecessary losses at the cold end. With IR-D, the correlation from (critical) defects to the circumstances or event is clearly indicated. Knowing when these relate to swabbing only the badly affected glass containers are detected and rejected. Cause and effect relationship is visible in real-time. Examples of defects caused by swabbing are shown in figure 2.
Swabbing performance
As explained previously, there are many people (operators) that have the blank swab as their main task: In general, blanks are swabbed with an interval of 20 minutes, sometimes even more often. In factories with 10 lines in a three shift operation, for example, the number of operators easily adds up to 50-60 people. They all need to swab exactly the same for the best result in terms of process stability but everybody knows this is utopia.

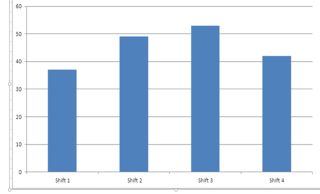
With IR-D, differences between shifts can be compared and evaluated based on facts. Figure 3 shows the swabbing performance for two different shifts. All parameters as indicated in figure 1 can be evaluated for each shift and even for each operator. In this way, it can be determined which operators do well and which need extra training to increase their swabbing performance.
Also quantified in terms of numbers of bottles missing and rejected after swabbing, the IR-D provides the impact in terms of losses (figure 4).
Swabbing is the solution
Many operators solve problems in cavities by swabbing the blanks without understanding the origin of the problem. Instead of finding the root cause and eliminating the source of the event, the operator chooses the easy way to swab more. And yes, the problem often disappears… but only temporarily. The root cause still exists and the issue returns after some time (sooner or later). Nevertheless, this is done again and again.
After one short look into the infrared data in IR-D, operators can make their lives easier. The information shows relationships to process anomalies clearly (see figure 5). These should be fixed by the operator, instead of swabbing the blanks over and over again.
Benefits
In relation to swabbing blanks and neck rings, the IR-D gives many advantages and opportunities for continuous improvements. When improving swabbing routines by the operators, results will immediately be visible in a reduction of rejected ware. Less impact of swab to the process gives the opportunity to reduce the standard IS rejects after swabbing. Ultimately, one can even reduce this to zero and leave the detection and rejection of swab bottles to the IR-D. Furthermore, a gain is achieved in reducing defects due to the swabbing impact. IR-D is the first filter for this but it will also be visible in lower CE rejects.
Lastly, better and especially more precise swabbing routines maintain the forming process in stable condition, with less need for frequent swabbing. Increasing the swab interval 50% (20 to 30 minutes), for example, leads effectively to higher pack-to-melt performance. In this context, the longer stand time of blanks and less mould maintenance is not even mentioned.
Condition of equipment
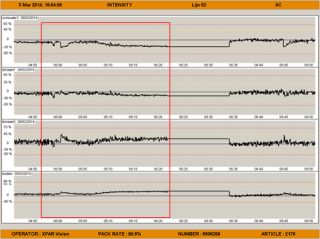
There is more where the production and maintenance departments can benefit from infrared information given by the IR-D. Infrared is the only sensor that ‘sees’ already minimal changes in glass distribution in a container. These changes often have different root causes. One of these causes is the (mal)functioning of IS parts. An example is how cooling valves perform. A failure of a cooling valve is detected by IR-D as the heat transfer between parison and blanks are affected. Blanks are heating up and it shows instantly in the glass distribution of the container. Figure 6 shows this event.
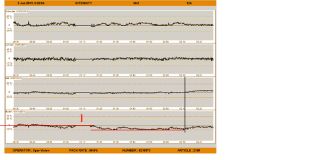
What many users of IR-D often fail to realise is that infrared also gives valuable information about the state of the blanks used. The production department depends on the quality of the blanks provided by the mould shop but does not have any guarantee that moulds are always in optimal condition when they are put onto the IS machine. The IR-D can be of great help here. An example is the blank volume. Due to mould maintenance, the volume of blanks gradually changes until the mould shop performs repairs. In the meantime, the IR-D gives a good indication of the blank volume by the infrared intensity (glass thickness) measurement in the bottom. If the volume is enlarged, the bottom thickness will change. Figure 7 shows the difference before and after a blank exchange.
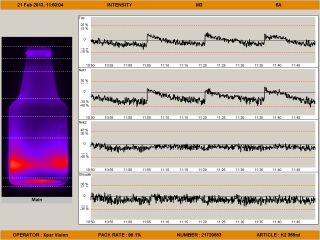
Another phenomenon is deterioration of the coating of the blanks. Mostly, the blanks are pre-coated in the mold shop. If this coating is not properly applied or during production the coating wears out, friction in blanks will increase, resulting in less deep loading of the gobs into the blanks. This effect appears in the control charts of the particular cavity. One can observe a pattern of decreasing infrared intensity in the neck areas of the glass container between swab operations (see figure 8).
Also, the type of coating applied can be influential. A freshly coated blank put into the cavity gives a significant change in glass distribution of the container because of reduced heat exchange. In time, this fades out when the coating wears out. Often, this effect is not compensated by the operator in the IS timing as it is seen as a temporary effect, even though it can take an hour or more to fade out by itself. This is a disturbing factor to the stability of the forming process, which could lead to defective bottles. Figure 9 gives an example of this effect.
Process disturbances due to equipment performance might seem endless but they always reflect on glass thickness or glass distribution effects that compromise the quality of the containers produced.
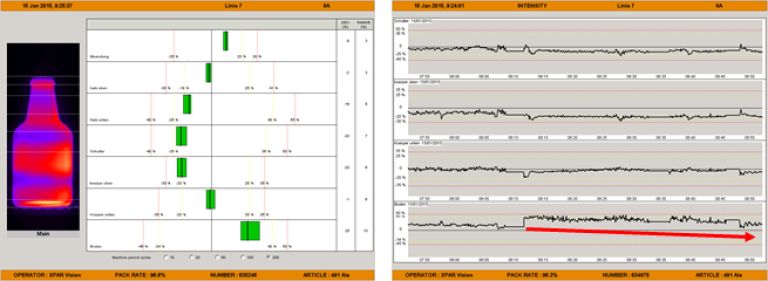
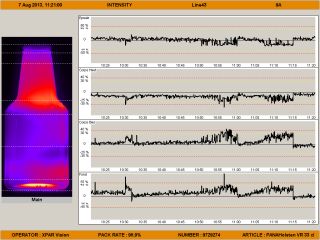
One further interesting aspect is that IR-D can indicate malfunctioning of other process control equipment that is always expected to operate properly. In NNPB production, the production team relies on the proper functioning of process (plunger) control systems. Not only for the plunger operation but also to control bottle weight automatically. The setup and seamless functioning of this equipment is crucial for process performance and bottle quality. But how do operators or specialists know the process control equipment is not doing its job as expected. Infrared measurements by IR-D can be of help, as seen in example given in figure 10.
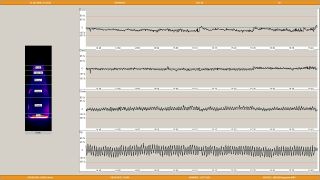
Oscillations in the infrared intensity in the bottom part of the bottle indicate an overreaction of the process control system, resulting in weight fluctuations of up to 3g. If unnoticed, this will lead to extensive loss of production.
Conclusion
In summary IR-D’s infrared measurements of each glass container unveil many process disturbances originating from manual intervention, equipment condition, system malfunctions or simply from wrong IS timing setup. They all lead to process instability and consequently to quality problems of the ware produced. Finally, all compromise deliveries to customers and lead to loss of profit.
Full use of the IR-D system and the information given to optimise process stability is where the benefits are the most.
It is explained in this issue of ‘Amazing discoveries… 16’ that IR-D infrared information is bringing extra added value in areas other than inspection and process monitoring of running production. Evaluation with infrared information of the forming process leads to process improvements, with important opportunities for companies’ to increase profitability. Introducing IR-D data/information to other departments than production and quality assurance will be a true eye opener.
Next steps
The scope of this ‘Amazing discoveries’ series of articles is to explore (pre)conditions and steps to be taken towards optimising process stability and reducing the weight-to-volume ratio of glass containers. By monitoring the influencing effects of (external) disturbances in the blank side, the IR-D offers great value. Control and stability of the blank side forming process are prerequisites for performance improvement in such areas as reduced product weight to reduce the carbon footprint of glass packaging. This answers the needs of customers of glass container manufacturers (see the first paragraph of this article) to secure or even regain competitiveness against other packaging materials.
In the next article of this series, the author will describe again the blow side of the forming process and then specifically the effects of materials used, blow head performance etc.
